World Cup 2026 Travel Distance Analysis: Ranking by Country
I investigated the travel distances between match venues for each national team in the 2026 World Cup.
At the bottom of this page, you will find a ranking of total travel distances assuming a team qualifies as the group winner.
【Related】World Cup 2026 Travel Distance Simulator
【Source】FIFA World Cup 2026 Match Schedule | FIFA
* Kick-off times are subject to change due to broadcasting requirements.
* Travel distances are calculated as linear distances (as the crow flies) between venues and do not account for round trips to base camps. (This represents the absolute minimum distance.)
1. Key Travel Challenges
This tournament combines the "vast distances of Russia 2018" with the "climate disparities of Brazil 2014" (plus the scattered nature of EURO 2020). Here are the four major travel challenges teams will face:
-
1. Massive Distances
Simply put, the distances are enormous. While the figures on this page represent the minimum linear distance between venues, numbers exceeding 10,000 km are common. In reality, total travel will be significantly longer due to round trips to base camps.
-
2. Climate & Altitude
Teams face temperature changes moving North-South and humidity changes moving East-West. The most critical factor is the altitude in Mexico. Some routes involve moving from Atlanta's Mercedes-Benz Stadium (300m above sea level) directly to Mexico City's Estadio Azteca (2,200m high altitude with thin air). This imposes a physical burden that air conditioning alone cannot solve.
-
3. Time Zones
Spanning the North American continent means dealing with up to a 3-hour time difference. Traveling West to East (e.g., Los Angeles to New York) is particularly brutal; you lose 3 hours of sleep while already exhausted from travel. In a tight schedule (e.g., 3 rest days), this directly impacts recovery.
-
4. Border Control
Routes between Canada/Mexico and the USA require passing through immigration every time. The mental stress and time lost in a "2,000km international flight" differ significantly from a "2,000km domestic flight."
2. Group Disparities
Group F: A Balanced Example
Group F (featuring Japan and the Netherlands) serves as a good example of a structurally balanced group. While it may not be as compact as Group I, it avoids the extreme logistical inequalities seen in other groups. The travel distances are distributed relatively evenly among the four teams, creating a fair competitive environment without the burden of excessive travel disparities found elsewhere.
Extreme Disparity: Groups A, B, J
Group J pairs Argentina, traveling only about 700km, with Algeria, which is forced to shuttle between Kansas City and San Francisco (2,400km apart with a 2-hour time difference). Algeria faces a significant disadvantage compared to Argentina and Austria.
Group B is tough for the Bosnia and Herzegovina winner. They must travel: Group Stage → Toronto → (3,500km) → Los Angeles → (1,500km) → Seattle. Compare this to Qatar in the same group, who finishes 3 matches with only 1,500km of travel on the West Coast.
Group A mixes teams with easy travel (Mexico: 922km, Korea: 639km) and those with brutal itineraries (South Africa: 3,936km, Czechia: 4,526km). Czechia has it worst: traveling to Atlanta for the 2nd match, then back to high altitude for the 3rd. Mexico essentially enjoys a "VIP schedule" with 3 home games.
The "Travel" Jackpot (Group I)
While competitively arguably the "Group of Death" (France, Senegal, Norway), Group I is an absolute paradise logistically.
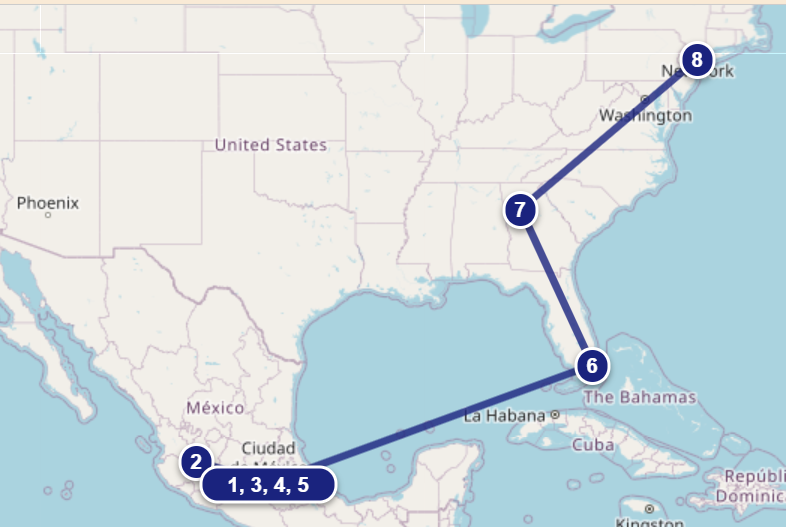
Matches are concentrated in the Northeast corridor (New York, Philadelphia, Boston), keeping the average travel distance to just 700km—the only group under 1,000km.
Even the worst-case scenario (Playoff 2) is only 976km.
For the team that survives this tough group as the winner, the reward is a highly compact Knockout Stage schedule. Excluding the host nations, this is the undisputed "Jackpot" group.
| Grp | Stats (km) | Travel Distance by Team (km) | ||||
|---|---|---|---|---|---|---|
| Avg | Gap | 1st (Shortest) | 2nd | 3rd | 4th (Longest) | |
| J | 2,767 | 4,109 | Argentina731 | Jordan2,383 | Austria3,114 | Algeria4,840 |
| A | 2,505 | 3,887 | Korea Republic639 | Mexico922 | South Africa3,936 | Czechia4,526 |
| B | 3,043 | 3,563 | Qatar1,476 | Switzerland2,299 | Canada3,359 | Bosnia and Herzegovina5,039 |
| G | 1,740 | 2,895 | Egypt195 | Iran1,740 | New Zealand1,935 | Belgium3,090 |
| D | 1,694 | 2,531 | Paraguay559 | Australia1,288 | Türkiye1,840 | USA3,090 |
| E | 2,463 | 2,344 | Ivory Coast1,080 | Germany2,644 | Curaçao2,705 | Ecuador3,424 |
| L | 1,738 | 2,249 | Panama550 | Ghana1,128 | Croatia2,477 | England2,799 |
| K | 2,611 | 2,101 | Portugal1,557 | Uzbekistan2,338 | Colombia2,891 | DR Congo3,658 |
| F | 1,433 | 691 | Sweden1,027 | Netherlands1,403 | Tunisia1,585 | Japan1,718 |
| C | 1,780 | 518 | Haiti1,507 | Brazil1,776 | Morocco1,812 | Scotland2,025 |
| H | 2,358 | 429 | Saudi Arabia2,104 | Spain2,367 | Uruguay2,430 | Cabo Verde2,533 |
| I | 676 | 426 | Senegal550 | France566 | Norway612 | Iraq976 |
3. Group Winner vs. Runner-up Scenarios
Group F: The "Runner-up" Advantage?
Along with Group H, Group F is one of the rare cases where finishing 2nd is logistically superior.
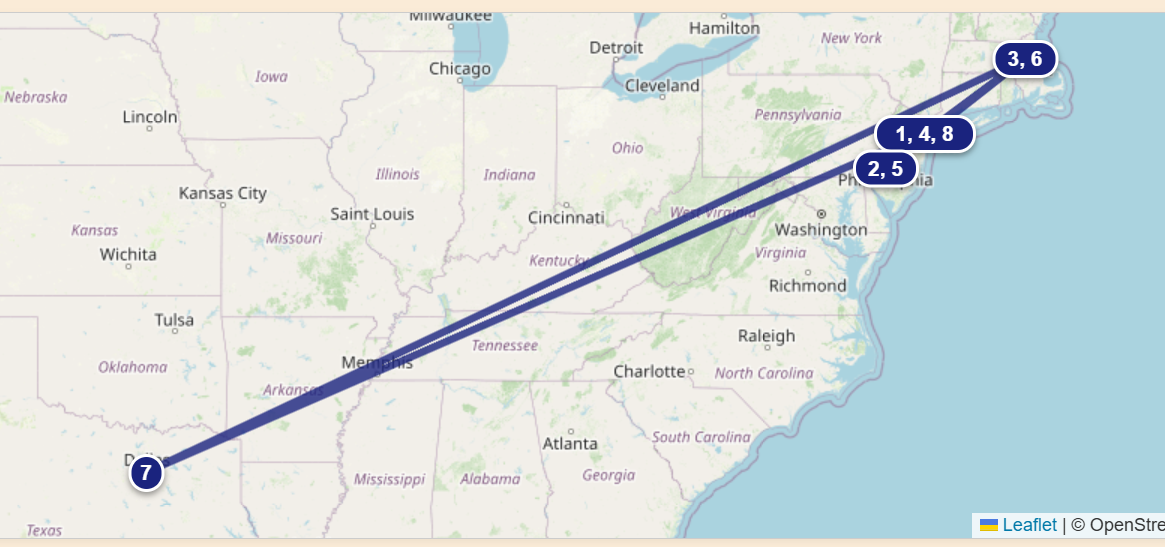
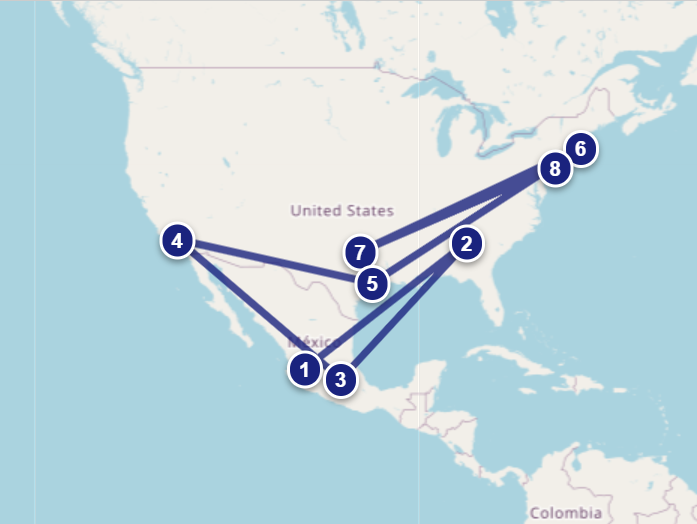
While the Group Winner faces a lighter opponent in the Round of 16, they are penalized later with a grueling 7,000km cross-country tour (Boston → Dallas → NY) from the Quarter-finals onward.
Conversely, the Runner-up stays relatively local.
For teams like the Netherlands or Japan, winning the group is strategically correct, but logistically punishing—a strange paradox in the tournament bracket.
Exceptions: Group H (The Ultimate Dilemma)
Group H presents the tournament's most difficult strategic paradox.
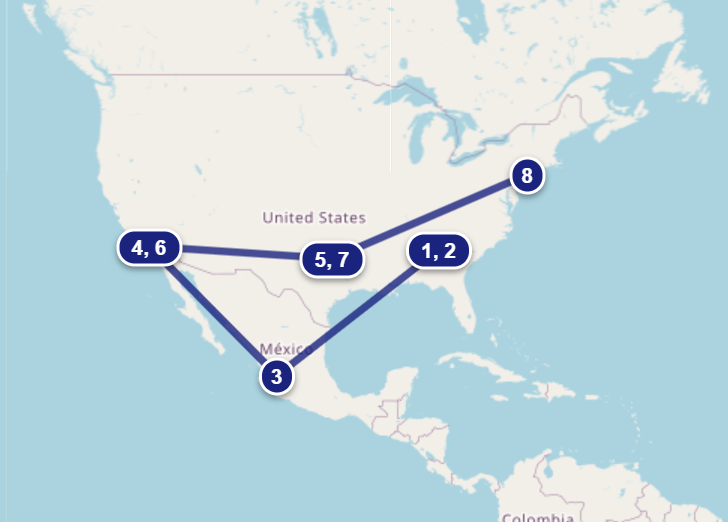
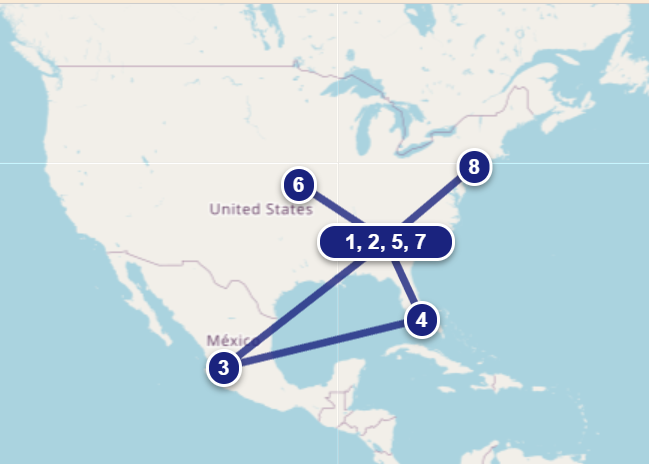
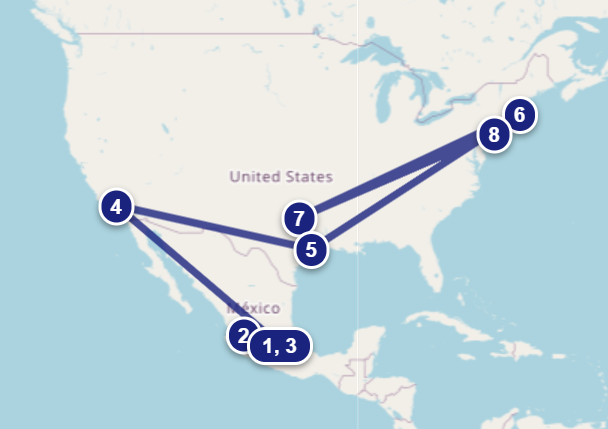
If a team (e.g., Spain) wins the group, they are condemned to a punishing "boomerang" route exceeding 12,000km.
Starting in the East (Atlanta), they must zigzag between the West Coast (LA) and Central (Dallas), before flying all the way back to New York.
In a high-intensity tournament where recovery is everything, this constant jet lag and lack of a stable base camp is a massive handicap.
In stark contrast, the 2nd place route keeps the team in Atlanta for 4 consecutive matches.
This offers perfect stability, zero travel fatigue, and full acclimatization to the venue.
The Reality:
Finishing 2nd likely means facing the World Champions, Argentina, in the Round of 32. Normally, this is a nightmare scenario to be avoided at all costs.
However, the physical toll of the "Winner's Route" is so severe that facing Argentina with a fully rested squad might actually be preferable to avoiding them but playing exhausted.
It is a choice between a "competitive nightmare" and a "logistical nightmare"—and in 2026, the logistics might be the deadlier opponent.
Mercedes-Benz Stadium Official Site
Air Conditioning at Mercedes-Benz Stadium
(The retractable roof and climate control make it a comfortable venue.)
Group K
Portugal (Group K) faces a tough road. Winning the group sends them from Kansas to Vancouver—a 2,500km flight plus immigration, climate shock, and a schedule disadvantage (88 hours rest vs opponent's 113 hours). Finishing 2nd isn't much better, sending them to Toronto with similar climate/travel issues.
Other Groups
For most other groups, the schedule is designed "normally": finishing 1st usually results in less travel than finishing 2nd.
4. Best & Worst Travel Itineraries
The Winners (Low Burden)
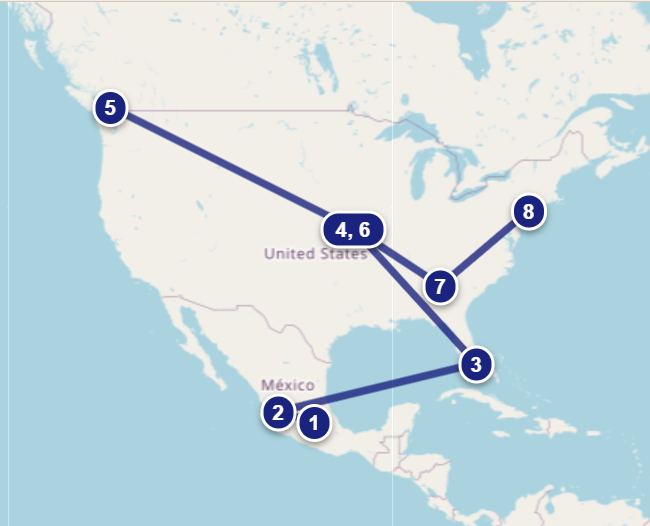
As mentioned, Group I is structurally the "VIP Group" for the winner.
Matches up to the Quarter-finals are contained within a 300km radius (New York, Philadelphia, Boston). They only travel to Dallas (Central) for the Semi-final.
(Only ~1,400km until QF)
The Hidden Victims
Czechia
The absolute worst scenario in the tournament.
If Czechia finishes 2nd and reaches the final, their linear travel distance hits 16,500km—3.2 times longer than Mexico's shortest route.
The route is so zigzagged it looks like a mileage run, not a tournament schedule.
Please root for Czechia; they need it. (Winning the group reduces this to a manageable 8,700km).
Colombia / Playoff 1 (Group K)
Whether 1st or 2nd, they face over 12,000km of travel. Even their "optimal" 1st-place route is double the distance of France or Mexico's route.
5. Summary
It has been discussed extensively, but the numbers confirm it: adaptation to travel, time zones, and climate will be critical in 2026. Success will depend not just on the players, but on the management capabilities of the staff—schedule management, recovery protocols, and logistics. Watching the tournament from this logistical perspective might add another layer of depth to the viewing experience. (Let's just hope we don't see too many injuries due to the brutal schedule...)
6. Total Travel Distance Ranking (If Qualifying 1st)
| No. | Grp | Team | Total (km) | Group Stage Route (1st → 2nd → 3rd) | Knockout Stage Route (R32 → 16 → QF → SF → Final) |
|---|---|---|---|---|---|
| 1 | A1 | Mexico | 5,163 | Mexico City → Guadalajara → Mexico City | Mexico City → Mexico City → Miami → Atlanta → NY |
| 2 | A3 | Korea Republic | 5,586 | Guadalajara → Guadalajara → Monterrey | Mexico City → Mexico City → Miami → Atlanta → NY |
| 3 | G2 | Egypt | 6,133 | Seattle → Vancouver → Vancouver | Seattle → Seattle → LA → Dallas → NY |
| 4 | I1 | France | 6,137 | NY → Philadelphia → Boston | NY → Philadelphia → Boston → Dallas → NY |
| 5 | I4 | Norway | 6,183 | Boston → NY → Boston | NY → Philadelphia → Boston → Dallas → NY |
| 6 | I2 | Senegal | 6,365 | NY → NY → Toronto | NY → Philadelphia → Boston → Dallas → NY |
| 7 | B3 | Qatar | 6,480 | San Francisco → Vancouver → Seattle | Vancouver → Vancouver → Kansas City → Atlanta → NY |
| 8 | I3 | Playoff 2 | 6,791 | Boston → Philadelphia → Toronto | NY → Philadelphia → Boston → Dallas → NY |
| 9 | J1 | Argentina | 6,870 | Kansas City → Dallas → Dallas | Miami → Atlanta → Kansas City → Atlanta → NY |
| 10 | E3 | Ivory Coast | 7,087 | Philadelphia → Toronto → Philadelphia | Boston → Philadelphia → Boston → Dallas → NY |
| 11 | B4 | Switzerland | 7,108 | San Francisco → LA → Vancouver | Vancouver → Vancouver → Kansas City → Atlanta → NY |
| 12 | D2 | Paraguay | 7,395 | LA → San Francisco → San Francisco | San Francisco → Seattle → LA → Dallas → NY |
| 13 | G3 | Iran | 7,678 | LA → LA → Vancouver | Seattle → Seattle → LA → Dallas → NY |
| 14 | G4 | New Zealand | 7,678 | LA → Vancouver → Seattle | Seattle → Seattle → LA → Dallas → NY |
| 15 | D3 | Australia | 8,124 | Vancouver → Seattle → San Francisco | San Francisco → Seattle → LA → Dallas → NY |
| 16 | L4 | Panama | 8,150 | Toronto → Toronto → NY | Atlanta → Mexico City → Miami → Atlanta → NY |
| 17 | B1 | Canada | 8,168 | Toronto → Vancouver → Vancouver | Vancouver → Vancouver → Kansas City → Atlanta → NY |
| 18 | E1 | Germany | 8,521 | Houston → Toronto → NY | Boston → Philadelphia → Boston → Dallas → NY |
| 19 | J4 | Jordan | 8,522 | San Francisco → San Francisco → Dallas | Miami → Atlanta → Kansas City → Atlanta → NY |
| 20 | L3 | Ghana | 8,599 | Toronto → Boston → Philadelphia | Atlanta → Mexico City → Miami → Atlanta → NY |
| 21 | E2 | Curaçao | 8,712 | Houston → Kansas City → Philadelphia | Boston → Philadelphia → Boston → Dallas → NY |
| 22 | A4 | Czechia | 8,767 | Guadalajara → Atlanta → Mexico City | Mexico City → Mexico City → Miami → Atlanta → NY |
| 23 | G1 | Belgium | 8,833 | Seattle → LA → Seattle | Seattle → Seattle → LA → Dallas → NY |
| 24 | C3 | Haiti | 8,850 | Boston → Philadelphia → Atlanta | Houston → NY → Miami → Atlanta → NY |
| 25 | A2 | South Africa | 8,883 | Mexico City → Atlanta → Monterrey | Mexico City → Mexico City → Miami → Atlanta → NY |
| 26 | C2 | Morocco | 9,155 | NY → Boston → Atlanta | Houston → NY → Miami → Atlanta → NY |
| 27 | D4 | Türkiye | 9,235 | Vancouver → San Francisco → LA | San Francisco → Seattle → LA → Dallas → NY |
| 28 | E4 | Ecuador | 9,301 | Philadelphia → Kansas City → NY | Boston → Philadelphia → Boston → Dallas → NY |
| 29 | J3 | Austria | 9,466 | San Francisco → Dallas → Kansas City | Miami → Atlanta → Kansas City → Atlanta → NY |
| 30 | C1 | Brazil | 9,548 | NY → Philadelphia → Miami | Houston → NY → Miami → Atlanta → NY |
| 31 | C4 | Scotland | 9,797 | Boston → Boston → Miami | Houston → NY → Miami → Atlanta → NY |
| 32 | F3 | Sweden | 9,831 | Monterrey → Houston → Dallas | Monterrey → Houston → Boston → Dallas → NY |
| 33 | L2 | Croatia | 9,948 | Dallas → Toronto → Philadelphia | Atlanta → Mexico City → Miami → Atlanta → NY |
| 34 | B2 | Bosnia and Herzegovina | 10,043 | Toronto → LA → Seattle | Vancouver → Vancouver → Kansas City → Atlanta → NY |
| 35 | L1 | England | 10,399 | Dallas → Boston → NY | Atlanta → Mexico City → Miami → Atlanta → NY |
| 36 | D1 | USA | 10,485 | LA → Seattle → LA | San Francisco → Seattle → LA → Dallas → NY |
| 37 | F2 | Japan | 10,522 | Dallas → Monterrey → Dallas | Monterrey → Houston → Boston → Dallas → NY |
| 38 | K3 | Uzbekistan | 10,756 | Mexico City → Houston → Atlanta | Kansas City → Vancouver → Kansas City → Atlanta → NY |
| 39 | K1 | Portugal | 10,887 | Houston → Houston → Miami | Kansas City → Vancouver → Kansas City → Atlanta → NY |
| 40 | F1 | Netherlands | 10,933 | Dallas → Houston → Kansas City | Monterrey → Houston → Boston → Dallas → NY |
| 41 | F4 | Tunisia | 11,115 | Monterrey → Monterrey → Kansas City | Monterrey → Houston → Boston → Dallas → NY |
| 42 | J2 | Algeria | 11,192 | Kansas City → San Francisco → Kansas City | Miami → Atlanta → Kansas City → Atlanta → NY |
| 43 | K2 | Playoff 1 | 12,076 | Houston → Guadalajara → Atlanta | Kansas City → Vancouver → Kansas City → Atlanta → NY |
| 44 | K4 | Colombia | 12,221 | Mexico City → Guadalajara → Miami | Kansas City → Vancouver → Kansas City → Atlanta → NY |
| 45 | H3 | Saudi Arabia | 12,492 | Miami → Atlanta → Houston | LA → Dallas → LA → Dallas → NY |
| 46 | H1 | Spain | 12,637 | Atlanta → Atlanta → Guadalajara | LA → Dallas → LA → Dallas → NY |
| 47 | H4 | Uruguay | 12,700 | Miami → Miami → Guadalajara | LA → Dallas → LA → Dallas → NY |
| 48 | H2 | Cabo Verde | 12,921 | Atlanta → Miami → Houston | LA → Dallas → LA → Dallas → NY |